DataGov Dashboard Data Governance
Use the Data Governance Dashboard to monitor governance activity through dashboard widgets, project filters, and time-period filters.
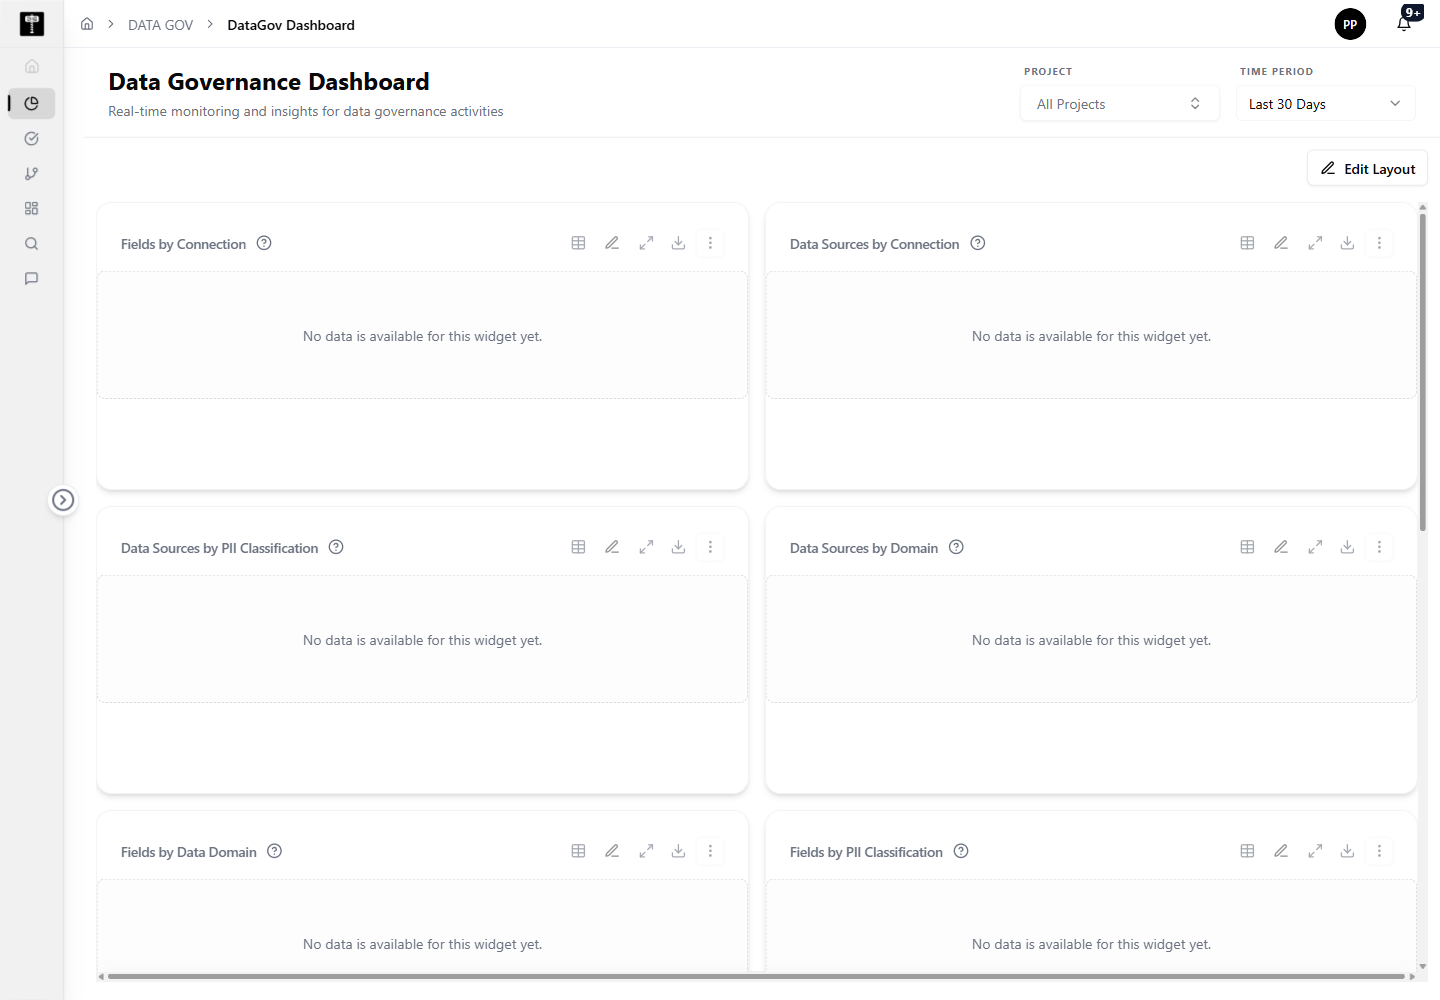
Review governance widgets
The dashboard shows a widget grid for governance reporting. In the captured environment, the visible widgets include:
- Fields by Connection
- Data Sources by Connection
- Data Sources by PII Classification
- Data Sources by Domain
- Fields by Data Domain
- Fields by PII Classification
Each widget includes controls for table/chart viewing, editing, expanding, downloading, and more options.
Filter the dashboard
Use the Project filter to scope dashboard results to a selected project. Use the Time Period filter to change the reporting window, such as Last 30 Days.
Edit the dashboard layout
Use Edit Layout when you need to rearrange or configure dashboard widgets. This supports dashboard personalization without leaving the Data Gov reporting page.
Typical path
| Step | Action | Location |
|---|---|---|
| 1 | Open DATA GOV | Main sidebar |
| 2 | Select DataGov Dashboard | Data Gov navigation |
| 3 | Choose a project and time period | Header filters |
| 4 | Review governance widgets | Dashboard grid |
| 5 | Edit layout or export widget data when needed | Widget controls |
What happens next
The dashboard helps governance users decide which catalog, audit, domain, glossary, or lineage area needs follow-up.