OpsHub Monitoring Dashboard
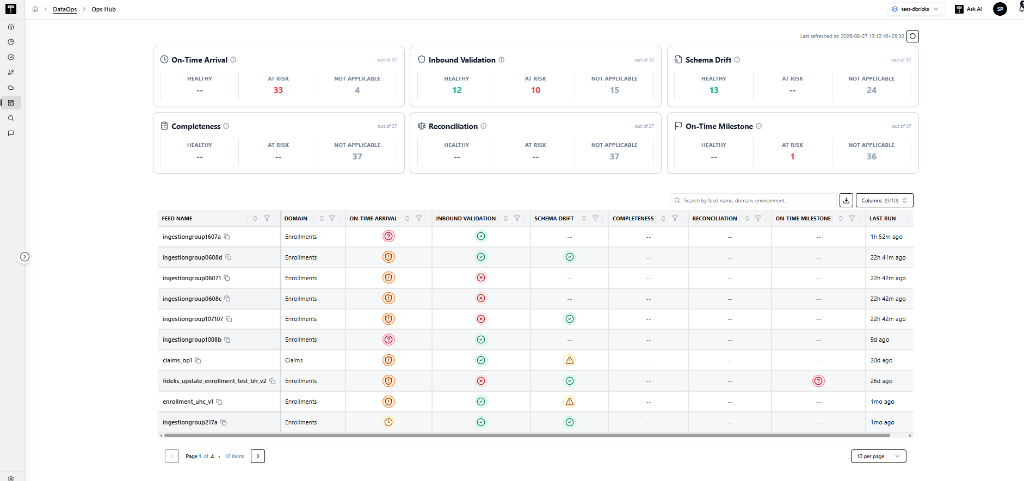
OpsHub is the central operational command center for monitoring the health, timeliness, and data quality of all your data ingestion feeds in real time.
Whether you are a Business Analyst, Operations Specialist, or Data Steward, OpsHub gives you immediate visibility into whether files have arrived on time, passed validation checks, maintained schema standards, and successfully reconciled across processing stages.
Why OpsHub is Needed
In enterprise data environments, dozens or hundreds of data feeds arrive daily from external partners, internal applications, and core transactional systems. Tracking each feed manually is time-consuming and error-prone.
OpsHub solves this challenge by:
- Eliminating Blind Spots: Continuously evaluates Service Level Agreements (SLAs) and data quality rules without requiring manual log inspections.
- Proactive Issue Detection: Instantly alerts operations teams when feeds are late, missing, corrupted, or structurally modified.
- Faster Incident Triage: Pinpoints exact root causes (e.g., a missing required column, an unexpected delay of 25 minutes, or a record count variance) directly from interactive tooltips.
- Single Pane of Glass: Aggregates health metrics across different compute environments and business domains in one intuitive view.
Key Dashboard Components
The OpsHub dashboard is organized into four main sections:
1. Environment & Global Controls (Header)
Located at the top-right of the dashboard:
- Environment Selector (e.g.,
test-dbricks,prod-aws): Allows you to switch the monitoring scope between testing, staging, and production environments. - Refresh Button: Refreshes all metrics and status badges to reflect the latest evaluations.
- Last Refreshed Timestamp: Displays the exact local time when dashboard data was last retrieved.
2. Metric Summary Cards (Top Matrix)
Six responsive summary cards provide an instant executive overview of system health across six critical operational dimensions:
- On-Time Arrival: Tracks whether incoming source files landed in storage by their expected scheduled cutoff.
- Inbound Validation: Tracks whether incoming files passed structural integrity checks.
- Schema Drift: Tracks whether the structure of incoming data matches the registered table definition.
- Completeness: Tracks whether the volume of ingested records meets the minimum required thresholds.
- Reconciliation: Tracks whether record counts match between source and target stages without unexpected data loss.
- On-Time Milestone: Tracks whether downstream transformations (e.g., Bronze, Silver stages) completed by their required stage deadlines.
Each summary card displays:
- Total Monitored Feeds: e.g.,
out of 37feeds configured for this control. - Healthy Count: The number of feeds currently running smoothly and meeting all criteria.
- At Risk Count: The number of feeds currently delayed, breached, missing, or failed (highlighted in bold red for immediate triage).
- Not Applicable Count: The number of feeds where this particular control is disabled or not yet scheduled to run.
- One-Click Filtering: Click on any metric (such as At Risk) to instantly filter the table below to show only the affected feeds.
3. Grid Search & Column Customization
Above the feed table on the right:
-
Search Bar: Type a feed name, tag, domain (e.g.,
Enrollments,Claims), or environment keyword to quickly filter and find matching records in real time. -
Export: Allows users to download or copy the currently filtered table data in different formats for reporting, analysis, and offline use.
- CSV (.csv): Downloads the filtered table data as a CSV file for reporting and offline analysis.
- Excel (.xlsx): Downloads the filtered table data as an Excel file for further analysis and reporting.
- Text (.txt): Downloads the filtered table data as a plain text file for simple sharing or reference.
- Copy to Clipboard: Copies the filtered table data to the clipboard so it can be pasted into another application.
-
Columns Selector: Customize the table view by selecting which columns you want to display. Use the Search columns option to quickly find a specific column, then select or deselect columns to show or hide them.
- Available Columns: Choose from fields such as Feed Name, Domain, On-Time Arrival, Inbound Validation, Schema Drift, Completeness, Reconciliation, On-Time Milestone, Last Run, and Last Evaluated.
- Show/Hide Columns: Select a column to display it in the table or clear the selection to hide it from the current view.
- Search Columns: Search by column name to quickly locate the field you need when multiple columns are available.
- Column Preferences: Your selected column configuration is automatically saved in your browser, so your preferred table layout is retained for future sessions.
4. Feed Health Matrix (Main Table)
The table displays each active ingestion feed as a row, with clear visual status badges for every enabled control:
| Column | Description |
|---|---|
| Feed Name | The unique, friendly name of the ingestion feed. |
| Domain | The business category the data belongs to (e.g., Enrollments, Claims, Billing). |
| On-Time Arrival | Current arrival status against the configured schedule and grace period. |
| Inbound Validation | Status of file-level structural checks (format, non-empty, size). |
| Schema Drift | Status of table schema comparisons (new columns, missing fields, data type changes). |
| Completeness | Volume check status against expected minimum record thresholds. |
| Reconciliation | Transformation reconciliation status and record count variances. |
| On-Time Milestone | Status of downstream pipeline stage completion times. |
| Last Run | Relative time elapsed since the feed's last execution (e.g., 30m ago, 21h ago). |
Understanding Health Statuses & Badges
OpsHub categorizes every control evaluation into three clear business buckets:
| Display Status | Meaning | What It Indicates |
|---|---|---|
| Healthy | Passed / On Time | The feed arrived on time, passed all validation checks, and met all quality rules. |
| Healthy (Warning) | Acceptable Drift / Minor Variance | Minor changes detected (e.g., a new optional column was added) that are permitted by business policy. |
| Healthy (Recovered) | Recovered | A previous delay or breach was resolved either automatically by a new file arrival or manually by an operator. |
| At Risk (Delayed) | Delayed (In Grace Period) | The file has not arrived by its expected cutoff time, but is still within the acceptable grace period window. |
| At Risk (Breached) | SLA Breached | The file arrived after the grace period expired or is significantly late. |
| At Risk (Missing) | Missing Data | The maximum waiting window elapsed and no data was received. Operational follow-up is required. |
| At Risk (Failed) | Validation Failed | A file integrity check failed (e.g., corrupt file, 0-byte file, missing required column, or reconciliation variance exceeded). |
| Not Applicable | Not Configured / Not Run | This control is not enabled for the feed or has not yet reached its first execution schedule. |
Diagnosing Issues with Interactive Tooltips
Diagnostic Card
Hover over any status cell in the table to open an interactive Diagnostic Card. The card provides detailed operational context for the selected control, helping users quickly understand the current status, timing, and reason for any issue.
The Diagnostic Card may include:
- Control Name: Identifies the control being evaluated, such as On-Time Arrival.
- Current Status: Shows the latest status of the control, such as Delayed, Recovered, Failed, or On Time.
- Severity: Indicates the operational severity of the current condition.
- Expected: Displays the expected date and time for the event, such as the expected file arrival time.
- Last Arrived: Shows when the latest file or data was actually received.
- Delta (min): Shows the difference between the expected and actual arrival time in minutes.
- Evaluated At: Displays when the control was last evaluated.
- Recovery Note: When applicable, provides details entered by the operator when the issue was marked as recovered.
- Reason: Explains why the control received its current status, including relevant operational details and whether the issue was recovered automatically or manually.
- Recovery Information: For recovered controls, identifies the recovery method and provides the associated recovery details.
The information displayed in the card changes based on the control status, so users can quickly understand what happened, when it happened, why it happened, and whether the issue has been resolved.
What You Can See in the Tooltip
-
Expected vs. Actual Times: Shows the expected arrival time and the actual time the data was last received.
-
Delay / Staleness: Displays the exact number of minutes the feed is delayed or how stale the data is.
-
Specific Error Reasons: Provides clear, human-readable details explaining why a control failed,
File count: 0 is below the minimum required count of 1orExpected file matching pattern was not found. -
Resolution History: For issues that have already been resolved, shows who marked the issue as recovered, when it was resolved, and the operational reason or note provided.
Resolving Incidents: "Mark as Recovered"
When an SLA breach, delay, or validation failure has been reviewed and the issue is considered resolved, an operator can manually mark the control as Recovered directly from the table.
-
Open the Diagnostic Card: Hover over the affected status cell to view the control details and confirm the issue that needs to be resolved.
-
Click "Mark as Recovered": Select the Mark as Recovered button from the Diagnostic Card. A confirmation dialog will appear.
-
Review the Confirmation Dialog: The dialog identifies the feed and control being recovered and confirms that a new RECOVERED entry will be recorded.
-
Add a Recovery Note (Optional): Enter a short operational note explaining why the issue is being marked as recovered. For example: "Test note for recovery." or "Vendor confirmed the delayed delivery was expected and the batch has been accepted."
-
Confirm the Recovery: Click Mark as Recovered to complete the action. Click Cancel if you do not want to make any changes.
-
Verify the Updated Status: After recovery, the status badge changes to Healthy (Recovered). The Diagnostic Card is updated with the recovery note and details about who performed the recovery and when.
Recovery Details
Once an issue is marked as recovered, the Diagnostic Card provides a record of the recovery, including:
- Recovery Note: The note entered by the operator when resolving the issue.
- Recovery Method: Indicates that the issue was resolved through Manual Recovery.
- Recovered By: Shows the operator who performed the recovery.
- Recovered At: Shows the date and time when the recovery was recorded.
- Original Issue: The control's original status and reason remain available for operational context.
There are two types of recovery:
-
Manual Recovery — An operator manually marks the control as recovered after reviewing and resolving the issue. The recovery record includes who performed the recovery, their email, and the date/time of recovery.
Example:
Manual Recovery — Recovered by mark (mark@xyz.ai) on 25 Aug 2026 at 01:03 PM. -
Auto Recovery — The system automatically marks the control as recovered when the issue is resolved during a subsequent ingestion run. No manual action is required from the operator.
Example:
Auto Recovery — Recovery completed on pipeline run.
This ensures that manual recoveries are visible and traceable, while preserving the history of what happened and how the incident was resolved.
Tips for Daily Operations
- Start with At Risk Filters: Click the red AT RISK count on the On-Time Arrival or Inbound Validation cards at the start of your shift to review outstanding incidents.
- Use Column Sorting: Click any column header to sort feeds by latest run time or domain to group related feeds together.
- Export Daily Summaries: Use the Export button to generate a CSV report for daily standups or stakeholder SLA reporting.