Operations & Troubleshooting Guide
This guide is designed for Operations Specialists, Data Stewards, and Business Analysts. It provides step-by-step procedures for configuring feed controls, interpreting OpsHub alerts, and executing day-to-day triage playbooks.
1. End-to-End Feed Control Configuration Walkthrough
Follow these steps to set up automated quality and SLA controls for any ingestion feed in the platform:
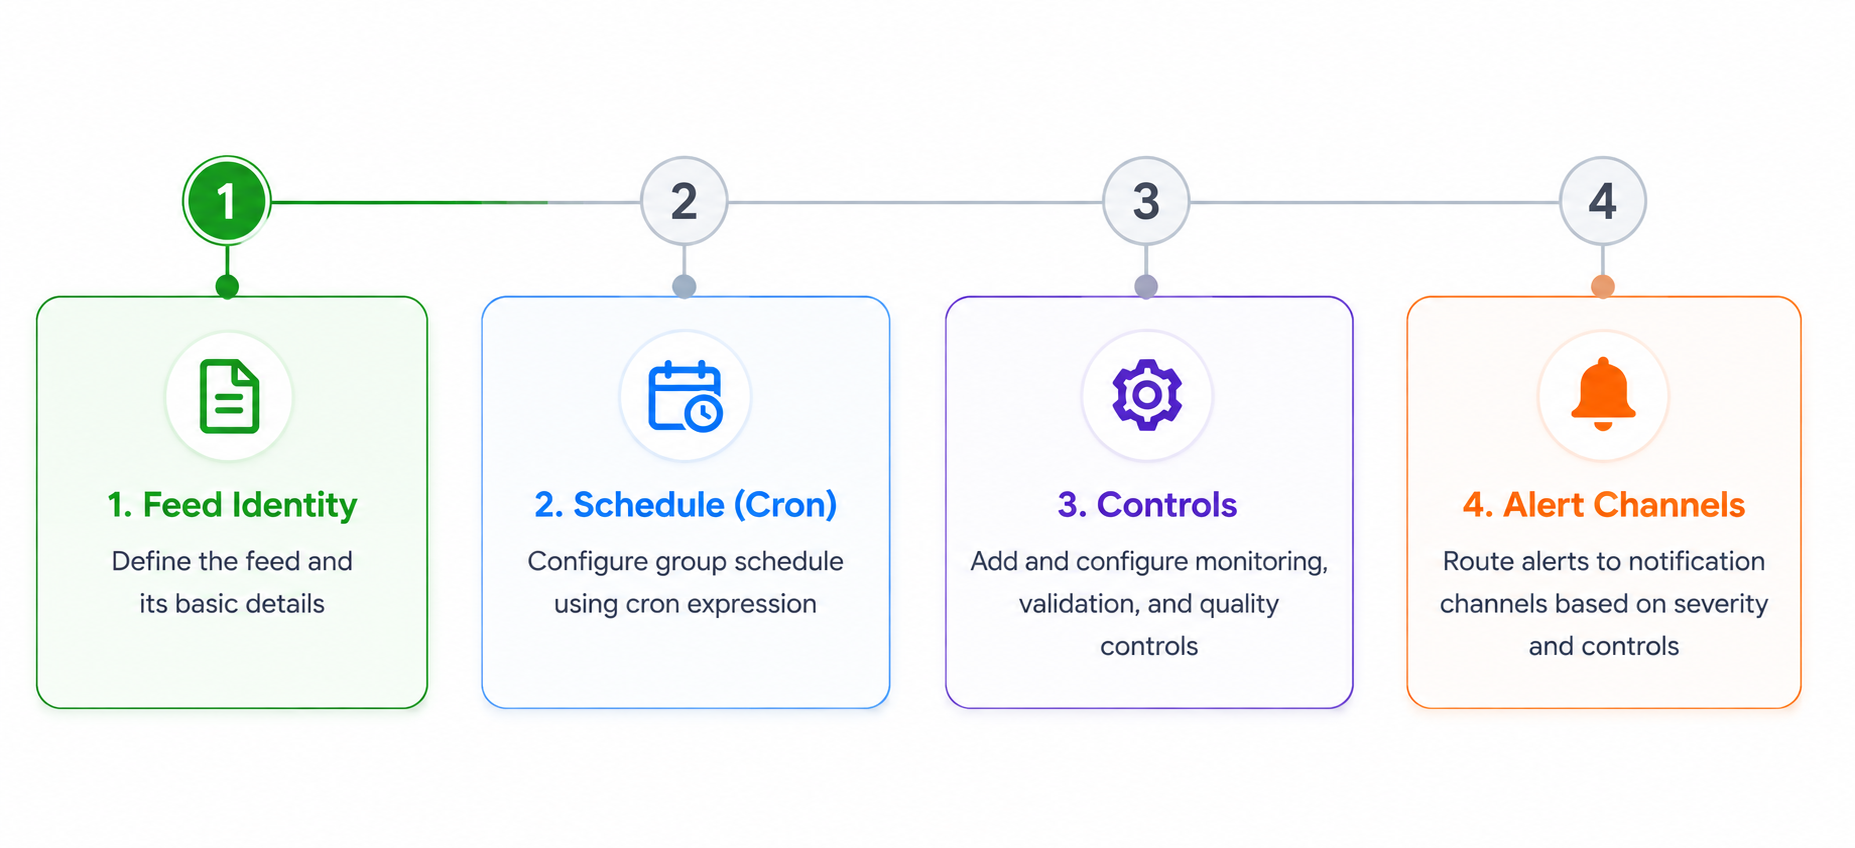
Step 1: Feed Identity
- Navigate to Pipeline > Ingestion and open your Ingestion Object Group.
- Select the Schedule & Monitoring step in the top wizard.
- In Subtab 1: Feed Identity:
- Feed Name: Enter a clear, descriptive name (e.g.,
enrollment_daily_v1). - Domain: Select the business domain (e.g.,
Enrollments,Claims,Billing). - Source System: Enter or select the upstream source system name.
- Timezone: Select the operational timezone (e.g.,
America/New_YorkorAsia/Kolkata). - Active: Ensure the toggle is switched ON.
- Feed Name: Enter a clear, descriptive name (e.g.,
Step 2: Schedule
- In Subtab 2: Schedule, choose your preferred method:
- AI Assistant: Type a sentence like "Every weekday at 6:30 AM" and click Generate ✨.
- Manual Cron: Enter standard cron syntax (e.g.,
30 6 * * 1-5) or pick a preset button (e.g., Daily at 9 AM).
- Verify the human-readable schedule description below the input box.
Step 3: Enable Quality & SLA Controls
- In Subtab 3: Controls, click
+Add Controls to enable the guardrails your feed requires:+On-Time Arrival: Set the expected arrival cutoff time (e.g.,10:15 AM), grace period (e.g.,30 min), and missing threshold (e.g.,120 min).+Structural Validation: Check the boxes forFILE_FORMAT,FILE_SIZE,FILE_COUNT, andNON_EMPTY_FILE.+Schema Drift: Enable to monitor for new, missing, or altered columns.+Completeness: Choose a stage (e.g.,Bronze) and enter the minimum required record count (e.g.,1000).+Reconciliation: Choose a stage (e.g.,Bronze → Silver Raw), set the acceptable variance tolerance (e.g.,0.5%), and max quarantined errors (e.g.,0).
Step 4: Configure Alert Routing
- In Subtab 4: Alerts:
- Select your Default Notification (Fallback) channel (e.g.,
Teams — DataOps-Alerts). - Assign specialized channels to individual controls if specific teams should handle particular errors (e.g., route Schema Drift to
Email — Governance-Team).
- Select your Default Notification (Fallback) channel (e.g.,
- Click Save & Publish. The controls are now active and will automatically evaluate during the feed's next scheduled run.
2. Operator Triage Playbook: Interpreting OpsHub Statuses
Use this triage matrix during daily operations when reviewing alerts or monitoring the OpsHub dashboard:
| Observed Status | What It Means | Immediate Action to Take |
|---|---|---|
| Healthy (On Time / Passed) | All files arrived on time and passed all checks. | No action required. Pipeline is running smoothly. |
| Healthy (Acceptable Drift) | Minor schema changes detected that are permitted by policy. | Review new optional columns in the Data Catalog to verify they are expected. |
| Healthy (Recovered) | Prior breach resolved by late arrival or operator action. | Review the recovery note on the HoverCard for audit tracking. |
| At Risk: Delayed | Data is past cutoff time but still within the grace period. | Check upstream vendor export status; monitor storage bucket for incoming files. |
| At Risk: Breached | File arrived late or grace period expired without data. | Contact the data provider/source team; check network transfer logs; escalate if blocking downstream reports. |
| At Risk: Missing | Maximum waiting threshold elapsed without data. | High-priority escalation: contact vendor support or data source lead immediately. |
| At Risk: Failed (Validation) | File format, empty file, or byte size check failed. | Hover over the red cell in OpsHub to identify the failing check; inspect the source file in landing storage. |
| At Risk: Failed (Reconciliation) | Transformation record count variance exceeded tolerance. | Check pipeline transformation logs for rejected/quarantined records; verify upstream source row count. |
| Not Applicable | Control is disabled or feed has not yet reached its first run. | If monitoring is desired, edit the feed in Ingestion Wizard and enable the control. |
3. Common Operational Scenarios & Troubleshooting
Scenario 1: A Feed Shows "Not Applicable" (--) in OpsHub
- Why this happens: Either the control is disabled in the feed's settings, or the feed is newly created and has not yet reached its first scheduled execution slot.
- How to fix:
- Open Pipeline > Ingestion and select the feed.
- Go to Schedule & Monitoring > Controls.
- Ensure the control toggle is switched ON and the feed's Active switch is enabled.
- Save and publish the configuration.
Scenario 2: Unexpected "Late / Delayed" Status (Timezone Mismatch)
- Why this happens: The feed was configured with a different timezone (e.g.,
UTC) than the business operations team expected (e.g.,America/New_YorkorAsia/Kolkata). - How to fix:
- Open Schedule & Monitoring > Feed Identity.
- Check the Timezone dropdown.
- Change the timezone to match the local operating region and click Save.
Scenario 3: Upstream Vendor Adds a New Column (Schema Drift)
- Why this happens: The vendor added a new column (e.g.,
customer_tax_id) to their daily extract that is not yet registered in your Data Catalog. - How to fix:
- If your policy is set to Accept / Rescue, the pipeline automatically ingests the column without breaking.
- If the feed failed under a Fail Batch policy:
- Review the new column in the OpsHub Diagnostic Tooltip.
Scenario 4: Resolving an Issue and Marking as Recovered
- Why this happens: A delayed file finally arrived and was processed, or the business accepted a known data anomaly.
- How to clear the alert:
- In OpsHub, hover over the red/amber status badge.
- Click Mark as Recovered.
- Enter an operational reason note (e.g., "Vendor experienced network outage; batch re-delivered and verified").
- Click Confirm. The status updates to Healthy (Recovered) 🔵 and logs your name and reason.